

Following my earlier post in Jan on how to track Singapore stock prices using Google Sheets, I thought it would be nice to be able to track cryptocurrency prices using Google Sheets as well, since I would most likely be investing in some crypto this year.
In this post, I will be sharing how to track the cryptocurrency prices at Coinmarketcap.com using Google Sheets.
Figuring out the URL
First thing to note is to figure out the URL to be used. Fortunately, for coinmarketcap.com, the URL for the cryptocurrency is pretty straightforward. For bitcoin, it is
https://coinmarketcap.com/currencies/bitcoin/
For ethereum, it is
https://coinmarketcap.com/currencies/ethereum/
Using IMPORTHTML to find the desired table of data
The next step is to use IMPORTHTML to locate the table of information containing the price of the cryptocurrency. I tried the below formula, through some trial and error, and located the table i need to use.
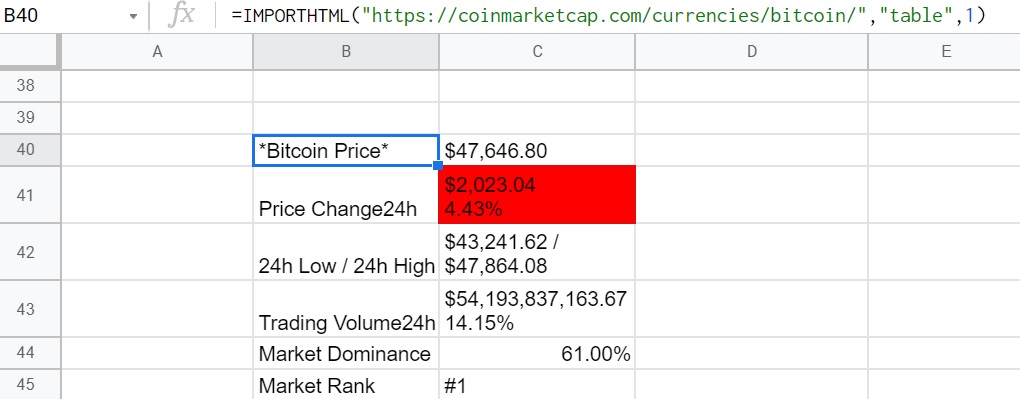
=IMPORTHTML(“https://coinmarketcap.com/currencies/bitcoin/”,”table”,1)

Extracting the Price using REGEXREPLACE
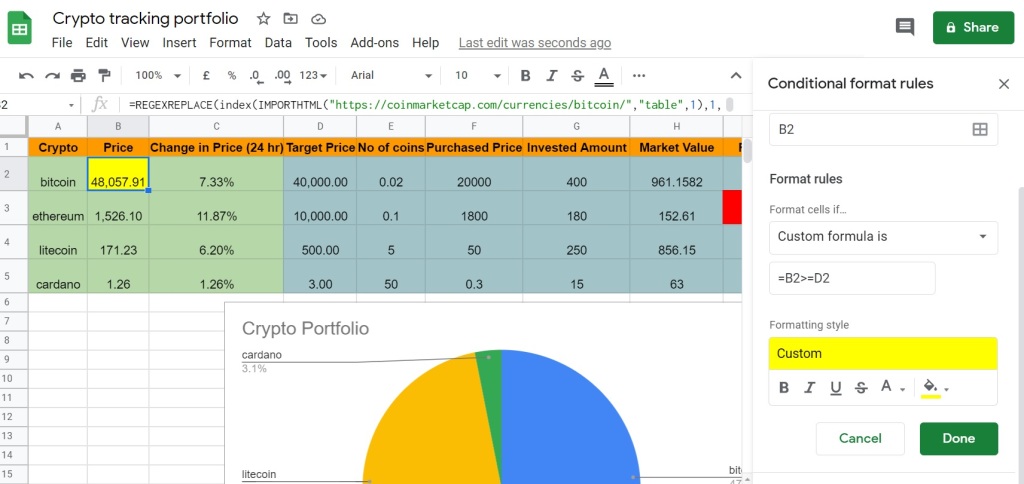
You can see the price and other information such as trading volume, price change (24 hr) listed in the table above. The price of bitcoin is located at the 1st row, 2nd column of the table. After entering the below formula to reference the 1st row, 2nd column, you would be able to extract the bitcoin price into Google Sheets.
=REGEXREPLACE(index(IMPORTHTML(“https://coinmarketcap.com/currencies/bitcoin/”,”table”,1),1,2),”[^\d]”,””)/100

Tracking Other Information for Trading Purposes
Suppose you are trading for short term profits, you may want to look at the price change (24hr) to see if it is time to realise some profits.
By entering the below formulae, you can track the price change (24 hr)
=(regexextract(index(IMPORTHTML(“https://coinmarketcap.com/currencies/bitcoin”,”table”,1),2,2),”(\n.*){1}”))
The regexextract function is to extract the 2nd line of information (see red highlighted box) in C41.
Conditional Formatting (Profit/Loss, Target Price setting)
You can also use Conditional Formatting to highlight your Profit/Loss. For losses, if Profit/Loss column (I2 to I5) is below zero, the cell will be highlighted red.
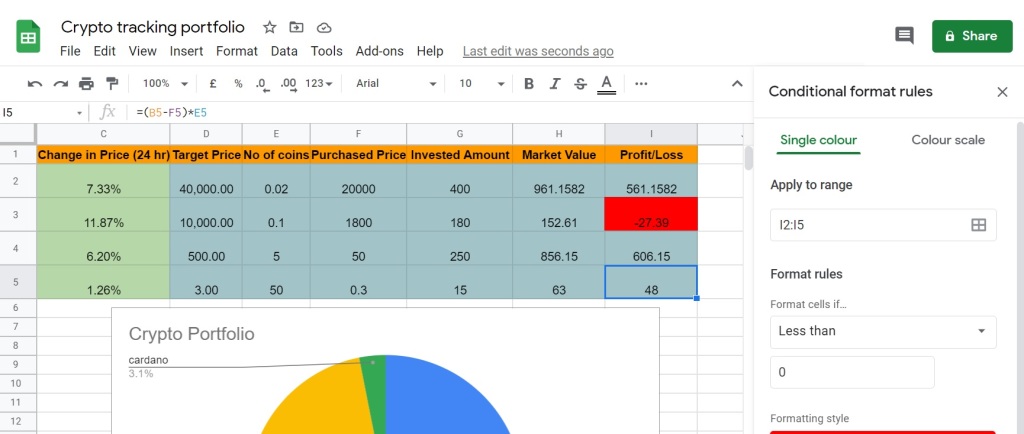
You can also use conditional formatting if the market price hits your target price. For example, if you want to cash out some BTC when it hits 40000 or higher, you can set the conditional formatting like below.
You can find the above simple Crypto tracking portfolio Google sheet here. I hope you find it useful.
Do drop me a message if you have any questions. I try my best to answer them.

One thought on “How to track cryptocurrency prices (Bitcoin, Ethereum, etc) using Google Sheets?”